The Revenue Formula You've Never Seen: Average Treatment Value × Visit Frequency × Active Patients
Most practices think growth means more patients. But a 10% improvement in each of three levers — treatment value, visit frequency, and active patient count — produces 33% revenue growth. And the order you optimize them matters.

Bill Eisenhauer
August 26, 2026 · 7 min read
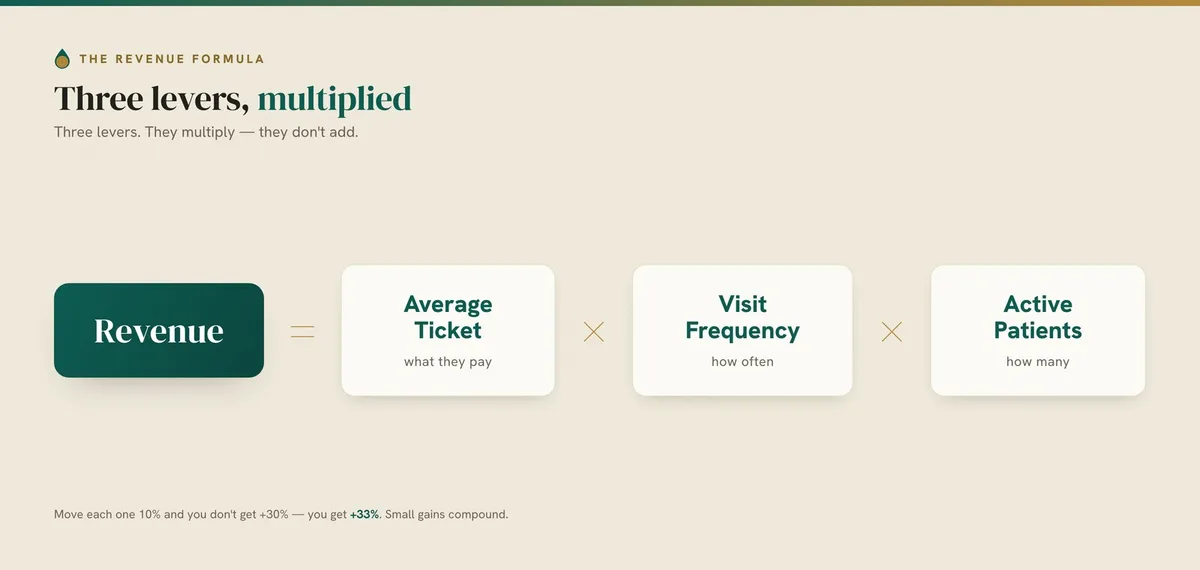
A 10% improvement in average treatment value, visit frequency, and active patient count produces 33% revenue growth — not 30%, because the gains are multiplicative. Most practices chase new patients exclusively, pulling the most expensive lever while ignoring two cheaper ones that compound on each other. The formula Revenue = Average Treatment Value x Visit Frequency x Active Patient Count gives you three levers instead of one, and optimizing them in the right order changes the economics of everything.
At a glance
- Revenue = ATV x Frequency x Active Patients — three levers that multiply, not add
- A $1M practice improves each lever by 10% and grows to $1.33M — $330K in additional revenue from three modest changes
- Optimization order matters: treatment value first (cheapest), frequency second (leverages improved value), patient count last (leverages both)
- Each 10% improvement is achievable within 90 days — a pricing adjustment, a rebooking system, and better consult follow-up
Key takeaways
- Revenue = Average Treatment Value x Visit Frequency x Active Patient Count. A 10% improvement in each produces 33% revenue growth — multiplicative, not additive. Most practices focus exclusively on patient count (the most expensive lever) and ignore the other two.
- The optimization order matters: Treatment value first (cheapest, fastest), visit frequency second (leverages improved treatment value), active patient count last (leverages both). The reverse order — which is how most practices operate — is the most expensive path.
- Score each lever 1-5 today. The lowest-scoring lever is where the 10% improvement is easiest to achieve. That’s your focus for the next 90 days.
- Each 10% improvement is achievable within a quarter — a pricing adjustment for treatment value, a rebooking system for frequency, and better consult follow-up for patient count. The compound effect of all three is transformative. The effort for each is modest.
- Take the free diagnostic → — see which of the three revenue levers has the most room to improve in your practice.
Why is “get more patients” the wrong default growth strategy?
Ask a practice owner how to grow revenue and the answer is almost always “get more patients.” It’s the default growth instinct, and it’s the most expensive lever to pull.
A growth strategist who spent decades analyzing service practices formalized an alternative: Revenue = Average Treatment Value x Visit Frequency x Active Patient Count. Three levers, not one. And the math of improving all three is multiplicative, not additive.
A 10% improvement in treatment value x a 10% improvement in frequency x a 10% improvement in patient count = 33% revenue growth. Not 30% (which is what additive thinking predicts). 33% — because each improvement multiplies the others.
For a practice doing $1M annually — say $350 average treatment x 4.2 visits/year x 680 active patients — that’s $330,000 in additional revenue from three modest improvements that, individually, feel almost trivial. Improve each lever by 10% and the same practice does $385 x 4.62 x 748 = $1.33M.
Why does the order of optimization matter?
Not all three levers are equally expensive or fast to improve. The strategic sequencing — which one to optimize first — changes the economics of everything that follows:
Optimize average treatment value first. Increasing the value per visit is the fastest lever because it requires zero new patients and zero additional appointments. A practice that adds a premium tier, an add-on treatment, or a value-based pricing shift increases treatment value without changing anything else about the operation. A med spa that introduces a $150 LED add-on to its $350 microneedling — and 30% of patients accept — raises average treatment value by $45 per visit. Every subsequent appointment — and every new patient — generates more revenue at the new treatment value. The improvement compounds forward.
Optimize visit frequency second. Once each visit is worth more, increasing how often patients return becomes more valuable per appointment. Rebooking systems, treatment plans, and membership programs address this lever — turning one-time patients into recurring patients and recurring patients into members. Members visit 2.9x more often and spend 35% more than non-members. A hormone therapy practice that implements pre-booked quarterly follow-ups instead of “call us when you need a refill” can move average frequency from 3.2 to 4.5 visits per year. Every additional visit happens at the already-improved treatment value.
Optimize active patient count last. Acquisition is the most expensive lever — 5-7x more costly than retention. But when each new patient arrives into a practice with improved treatment value and improved visit frequency, they’re worth 20-30% more over their lifetime than patients acquired before those improvements. With average patient LTV ranging from $3K conservative to $8K+ in a strong practice, marketing spend goes further when the practice they’re entering is already optimized. The compound impact of these optimizations is where the real money lives.
The reverse order — acquiring patients first, then trying to increase their value — is how most practices operate. It’s the most expensive path to the same revenue target.
How do you assess which lever needs the most work?
Treatment value signals:
- You haven’t adjusted pricing in over a year → pricing gap
- You don’t offer add-on treatments, bundles, or premium tiers → cross-sell gap
- Your consult-to-treatment conversion exceeds 80% → you’re underpriced
- Patients never push back on treatment cost → the market would bear more
- Your Botox price is within $1/unit of the clinic down the street → you’re competing on price, not value
Visit frequency signals:
- 40%+ of patients visit once and never return → rebooking gap
- You have no automated post-treatment follow-up sequence → patients forget you
- You can’t calculate time-to-second-visit → you’re not measuring the lever
- Patients complete a GLP-1 course and disappear → no transition to maintenance
- Your rebooking rate at checkout is below 50% → the front desk isn’t asking
Active patient count signals:
- Your consult inquiries depend on one channel (Instagram, Groupon, one referral source) → channel concentration risk
- Consult inquiry response time exceeds 30 minutes → speed-to-lead gap
- You have 2,000 patients in your PMS but only 400 visited in the last 12 months → reactivation opportunity
- You don’t know your cost per new patient → you can’t evaluate acquisition efficiency
Score each lever 1-5 based on current maturity. The lowest-scoring lever is where the 10% improvement is easiest to achieve — and that’s where you start.
What does a 10% improvement in each lever actually require?
These aren’t aspirational targets. They’re achievable within 90 days:
10% treatment value increase: Add one premium tier or one treatment add-on to your primary service. A med spa adding a $75 dermaplaning add-on that 20% of facial patients accept on a $250 base treatment increases average treatment value by $15 — a 6% improvement from one tactic. Stack a membership pricing tier and a post-treatment skincare recommendation, and 10% is conservative.
10% visit frequency increase: Implement a rebooking system. Pre-book the next appointment before the patient leaves. Send automated treatment-plan reminders at the clinically appropriate interval. If 10% of one-time patients convert to a second visit from a post-treatment email sequence alone, frequency improves proportionally. Add a membership program or seasonal treatment campaign, and 10% is well within reach. Remember: repeat patients spend 67% more per visit than first-timers.
10% active patient count increase: Not “10% more consult inquiries” — 10% more active patients from the inquiries you already have. Improve follow-up on unconverted consults, speed up consult response time, or reactivate lapsed patients from your PMS. A practice with 200 unconverted consults from last quarter that re-engages 20 of them has added 10% to active patient count without spending a dollar on advertising.
What does AI actually do for the revenue formula?
AI makes the three-lever model a living system rather than a quarterly exercise. An AI revenue optimization system tracks all three levers continuously — average treatment value, visit frequency per patient, and new patient conversion rate — and flags which lever has the most room to improve this month. It correlates specific actions with lever movement: “Average treatment value increased 3% after the LED add-on launched. Visit frequency improved 2% after the rebooking protocol went live. Active patient count was flat — consult follow-up completion rate dropped this month.” Instead of guessing which lever to focus on, the system tells you — and tells you why.
FAQ
What is the revenue formula for a med spa or cash-pay practice? Revenue = Average Treatment Value x Visit Frequency x Active Patient Count. Unlike the simplistic “more patients = more revenue” model, this formula gives you three levers to optimize. A 10% improvement in each produces 33% growth because the gains multiply.
Which revenue lever should I optimize first? Start with average treatment value. It’s the cheapest and fastest to improve — requiring zero new patients and zero additional appointments. Then move to visit frequency (leveraging the improved treatment value), and optimize active patient count last (leveraging both prior improvements).
How quickly can I see results from optimizing these levers? Each 10% improvement is achievable within 90 days. A pricing adjustment for treatment value, a rebooking system for frequency, and better consult follow-up for patient count. Practices that optimize all three in sequence typically see measurable revenue growth within one quarter.
Is this formula only for med spas? No. The formula applies to any cash-pay or recurring-service practice — hormone therapy clinics, weight-loss practices, longevity centers, dental practices with membership programs. Any practice where patients return on a cadence and where treatment value can be influenced through pricing, add-ons, or bundling.
How do I calculate my current numbers for each lever? Pull your average treatment value from your PMS billing data. Calculate visit frequency by dividing total visits by unique active patients over the last 12 months. Count active patients as anyone who visited in the last 12 months. Those three numbers multiplied should approximate your annual revenue.
Written by Bill Eisenhauer, Founder of Alchemy Inside.
Revenue & Growth
How much revenue is slipping through your follow-up gaps?
This article explored one category. The free diagnostic scores all six — and gives you a dollar estimate in 90 seconds.
Take the Free Diagnostic